3.1.4. Method for removing large stripes
A strongly smoothing filter is needed to remove large stripes. This, however, degrades the processed sinogram and gives rise to extra artifacts. To solve these problems, the correction is selectively applied to stripe locations only, which requires the stripe detection method. Detailed implementations of the method is shown as follows.
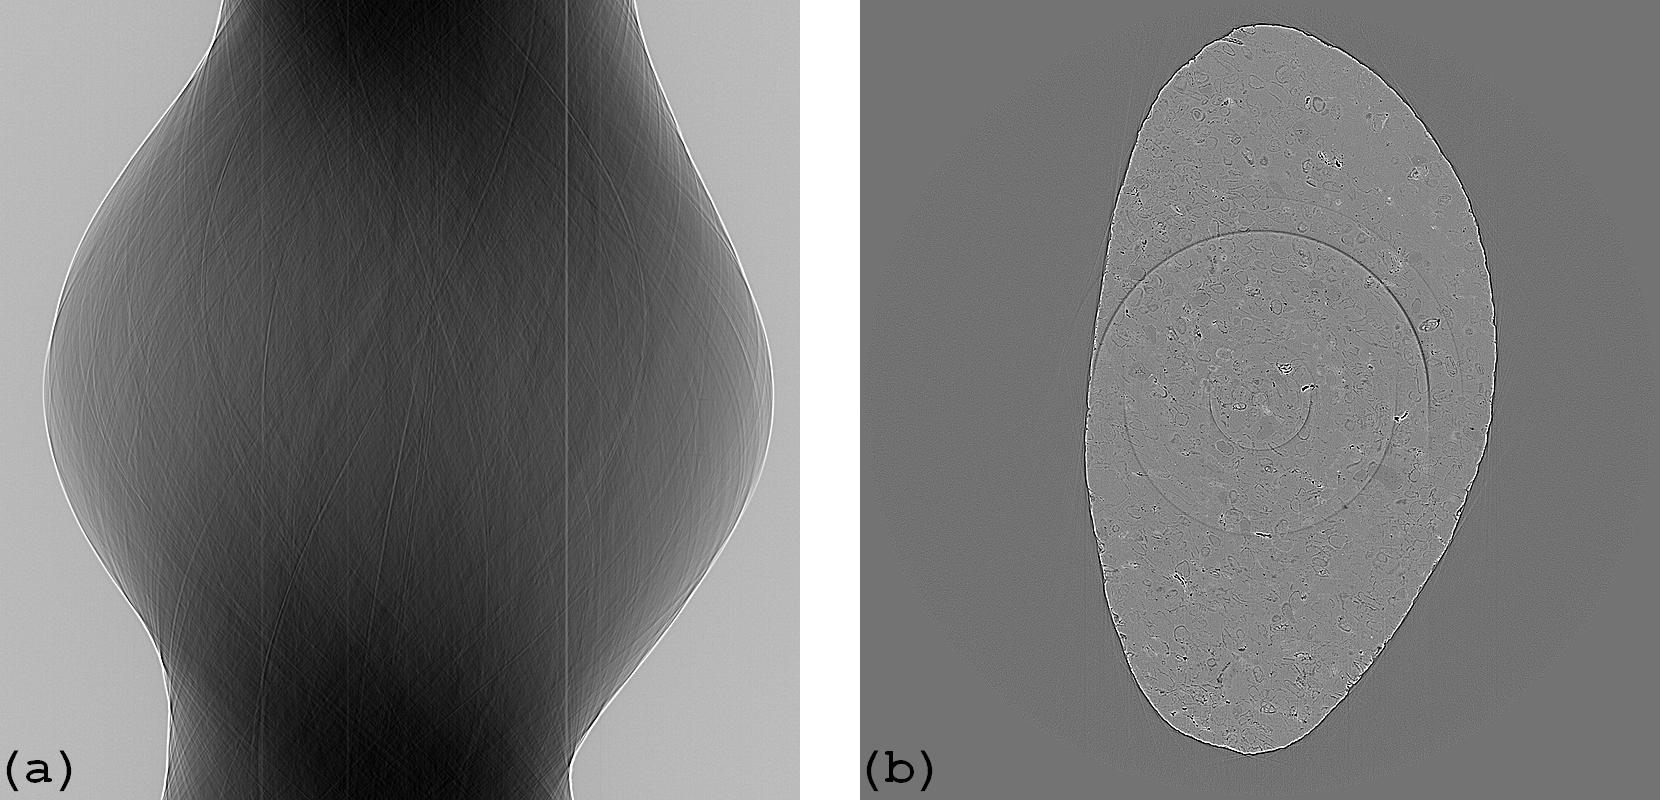
Figure 1. (a) Sinograms with large stripe artifacts. (b) Reconstructed image.
Code
- sarepy.prep.stripe_removal_original.remove_large_stripe(sinogram, snr, size, drop_ratio=0.1, norm=True)[source]
Remove large stripes, algorithm 5 in Ref. [1], by: locating stripes, normalizing to remove full stripes, and using the sorting technique (Ref. [1]) to remove partial stripes. Angular direction is along the axis 0.
- Parameters
sinogram (array_like) – 2D array. Sinogram image
snr (float) – Ratio used to segment stripes from background noise.
size (int) – Window size of the median filter.
drop_ratio (float, optional) – Ratio of pixels to be dropped, which is used to reduce the false detection of stripes.
norm (bool, optional) – Apply normalization if True.
- Returns
ndarray – 2D array. Stripe-removed sinogram.
References
How it works
1. Locating stripe artifacts
– Sort intensities in each column of the sinogram (Fig. 2(a)). Apply the strong median filter along each row to remove stripes (Fig. 2(b)).
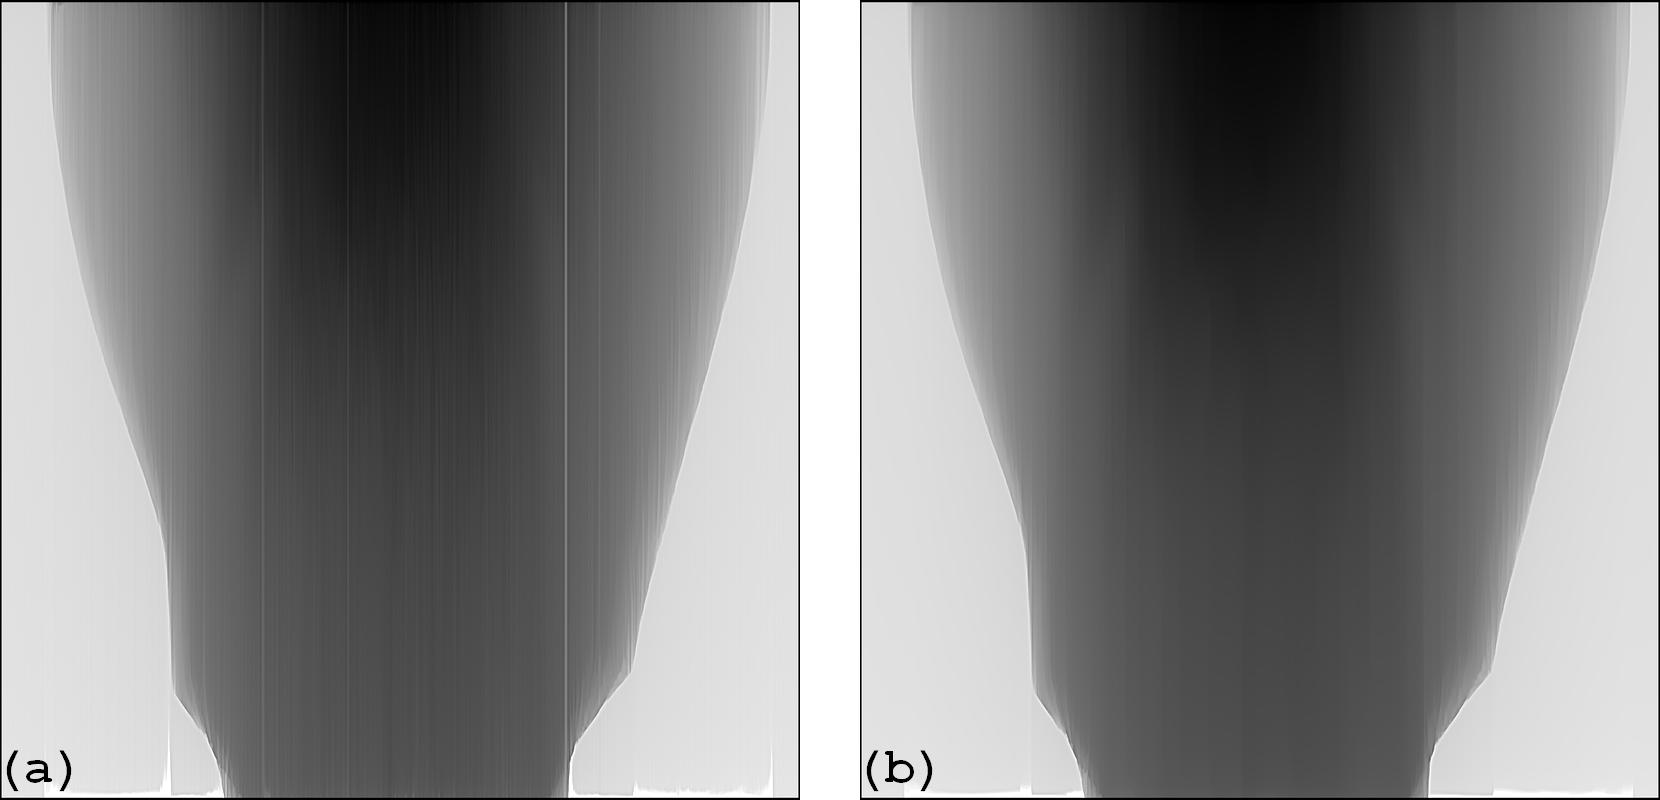
Figure 2. (a) Sorted sinogram. (b) Smoothed sinogram.
—Average along the columns of the sorted sinogram where some percentage of pixels at the top and bottom are dropped (Fig. 3(a), Fig. 4(a)). Do the same for the smoothed sinogram (Fig. 3(b), Fig. 4(b)). This simple technique helps to reduce the possibility of wrongly detecting stripes caused by high-frequency edges of the sinogram . It also can be used to improve other ring removal methods.
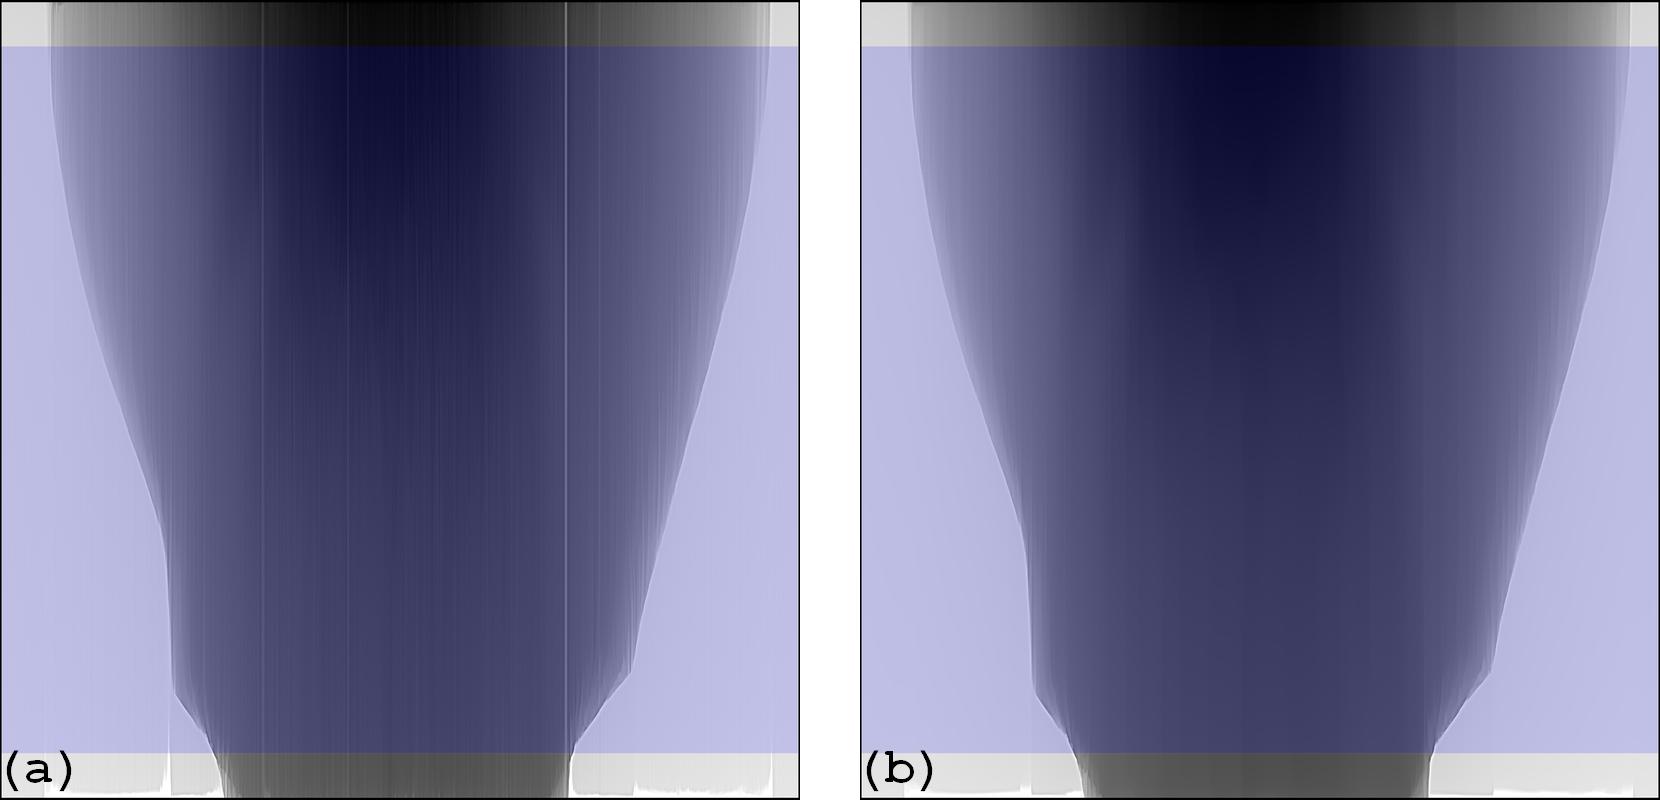
Figure 3. (a) Selected area for averaging in the sorted sinogram. (b) Selected area for averaging in the smoothed sinogram.
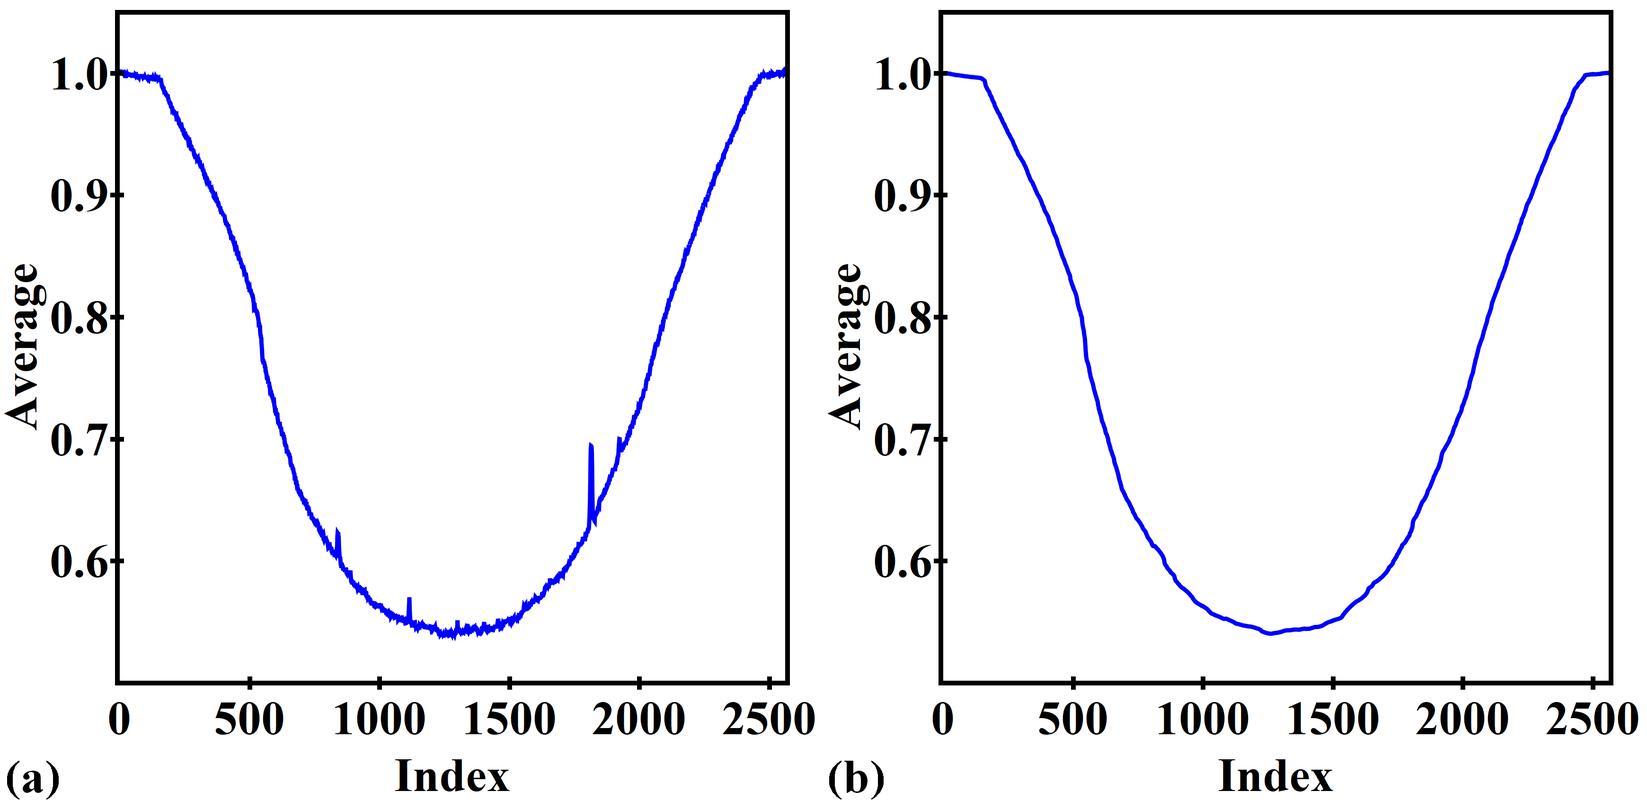
Figure 4. (a) Average result of the ROI in Fig. 3(a). (b) Average result of the ROI in Fig. 3(b).
—Divide the result shown in Fig. 4(a) to the result shown in Fig. 4(b) resulting in the normalized 1D array (Fig. 5(a)). Use the SFTS algorithm to get stripe locations (Fig. 5(b)).
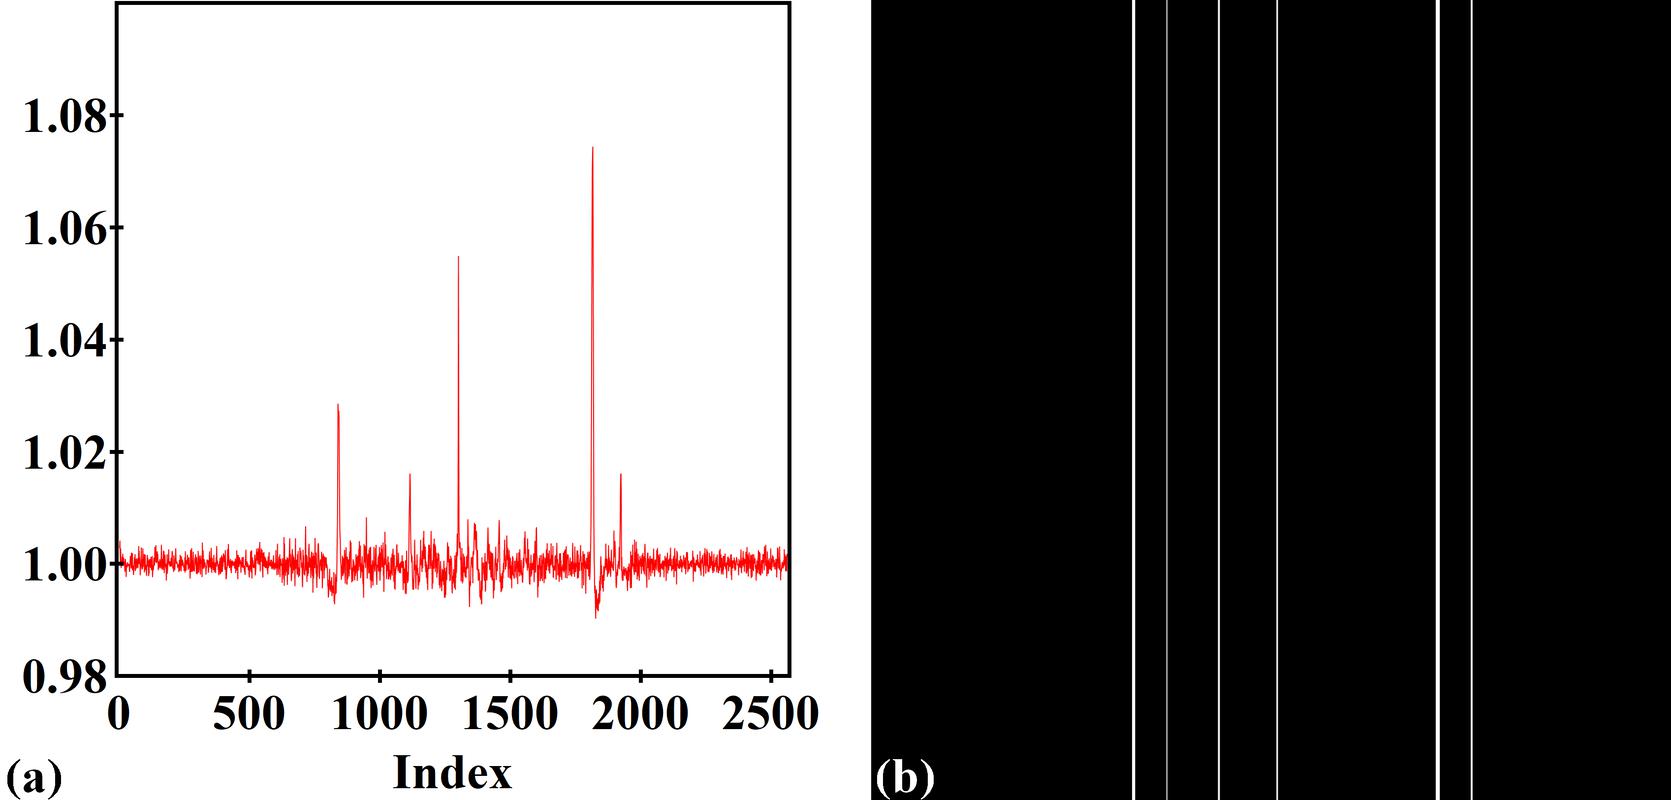
Figure 5. (a) Normalized 1D array used for the SFTS algorithm. (b) Mask indicating the stripe locations.
2. Normalization
– Normalize each row of the sinogram using the result shown in Fig. 5(a). This step is important to correct the non-uniform background around large stripes. Actually, it is a normalization-based stripe removal method. As a result, it can suppress full stripe artifacts but not partial stripe artifacts (Fig. 6).
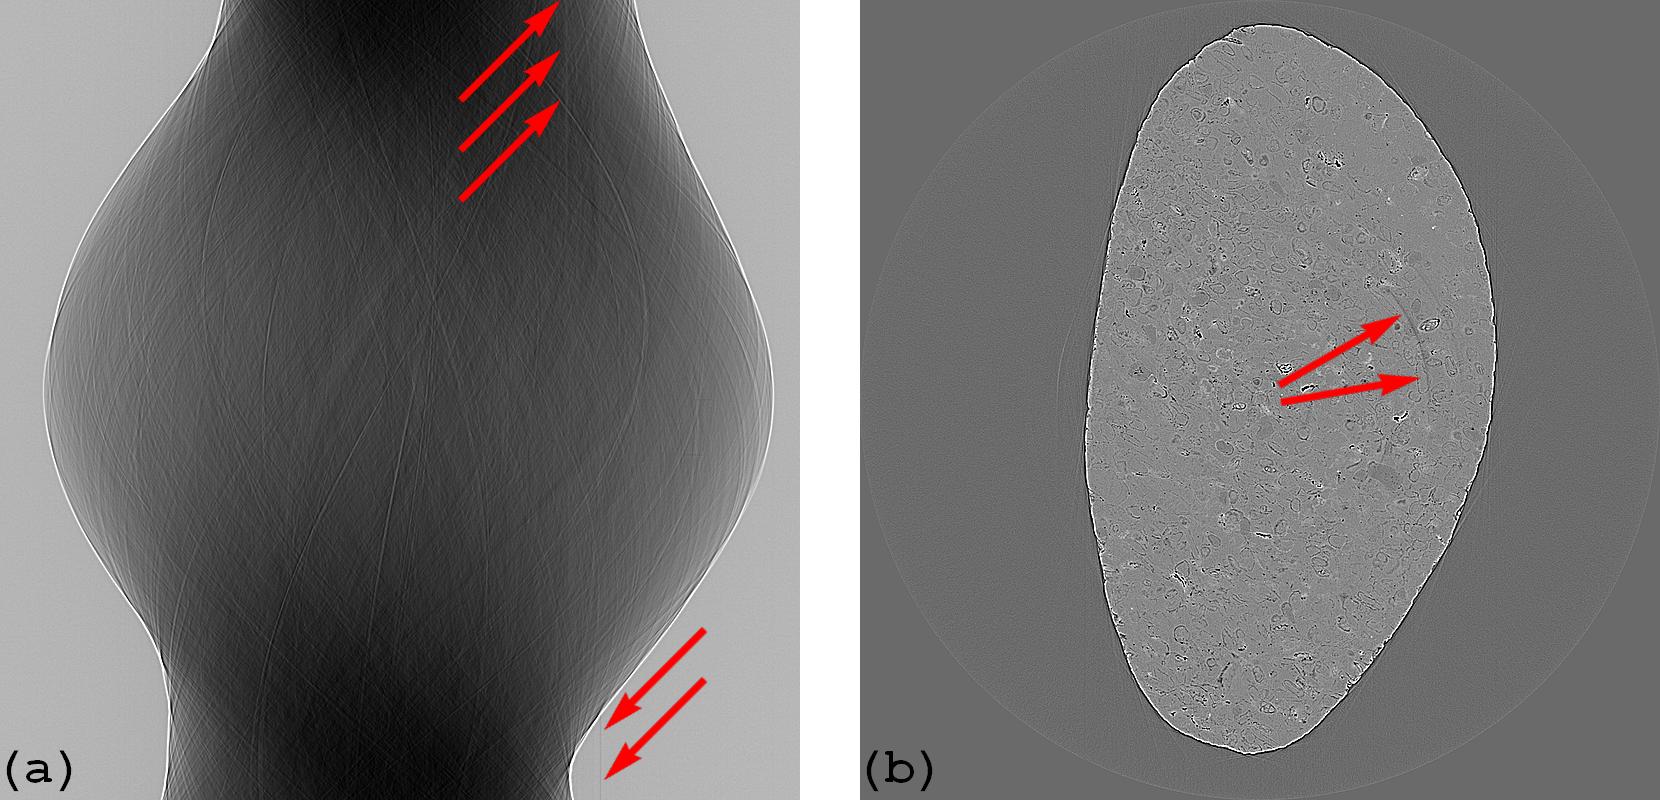
Figure 6. (a) Normalized sinogram. (b) Reconstructed image from sinogram (a).
3. Selective correction
– Partial stripes are removed using the sorting-based approach where only the intensities in the stripes of the normalized sinogram are corrected (Fig. 7).
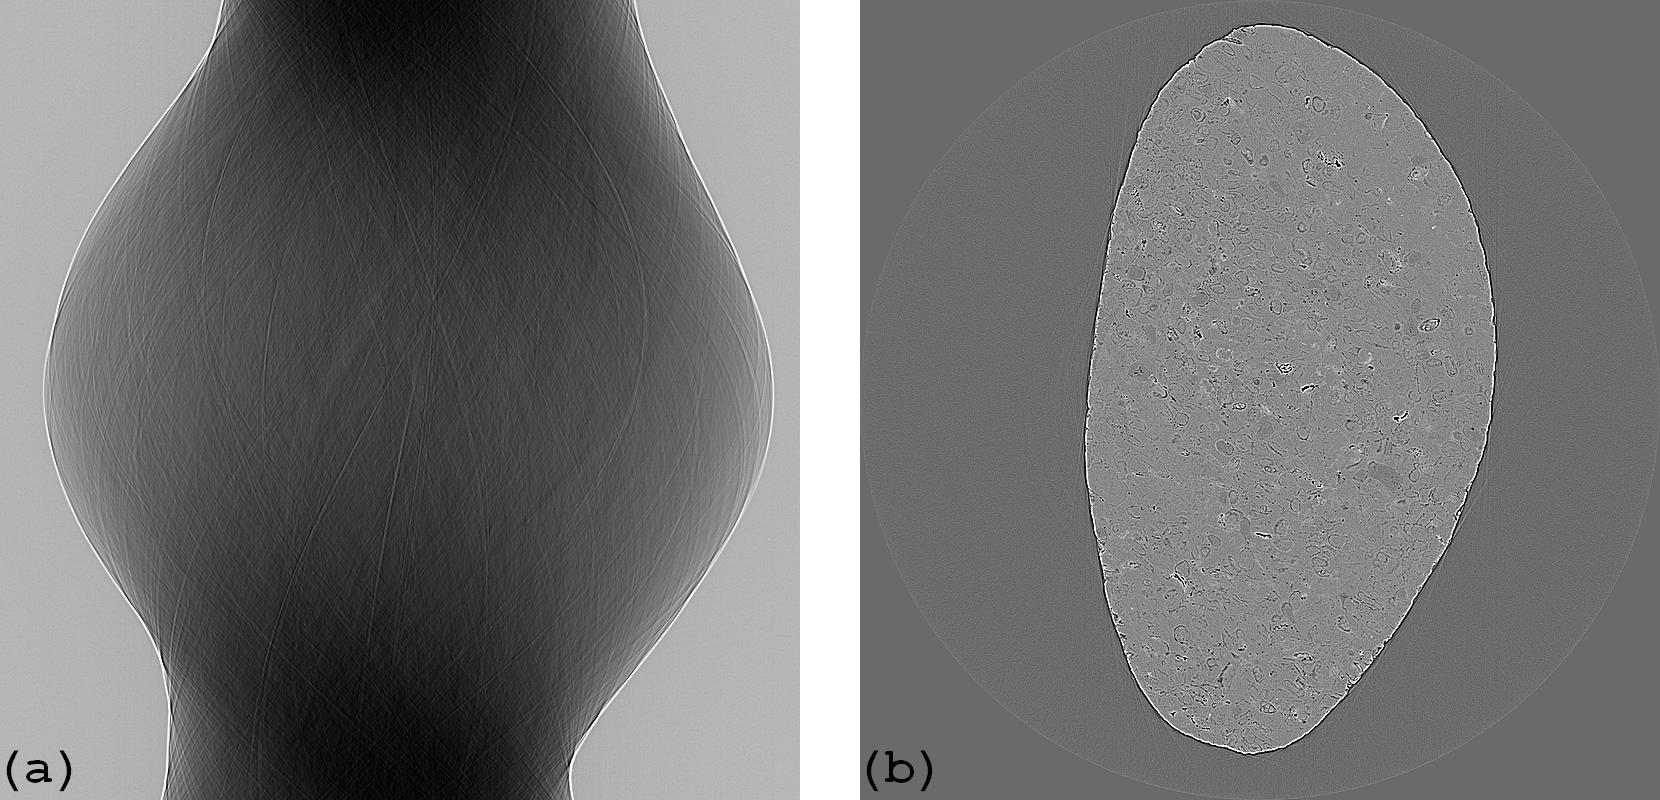
Figure 7. (a) Corrected sinogram. (b) Reconstructed image from sinogram (a).
How to use
– The snr parameter controls the sensitivity of the stripe detection method. Smaller is more sensitive. Recommended values: 1.1 -> 3.0.
– The size parameter controls the strength of the median filter and can be determined in a straightforward way by the size and the brightness of detector defects. Larger is stronger but more computationally expensive. As this method is selective correction, overestimated size is acceptable without degrading the final image too much. This allows users to use the same parameters across sinograms.
How to improve
The median filter can be replaced by another edge-preserving smoothing filter.